Accessible Usability Scale (AUS) analysis of desktop screen readers
User research results from over 1,000 AUS scores and recommendations for screen reader research engagements
| Assistive tech type | Total responses | AUS average | AUS median |
|---|---|---|---|
| Screen reader totals | 1191 | 55 | 55 |
| Screen reader | Total responses | AUS average | AUS median |
| JAWS | 568 | 57 | 58 |
| NVDA | 374 | 55 | 55 |
| VoiceOver | 249 | 50 | 50 |
Background
Measuring web accessibility
Today, the most relied upon marker for measuring web accessibility is adherence to the Web Content and Accessibility Guidelines (WCAG). WCAG is made up of 4 principles, 12+ guidelines, and 60 to 80 success criteria depending on the version and standard you’re referencing. WCAG criteria are effective as an evaluative tool, but difficult to leverage for product-led organizations.
In 2020, Fable began developing the Accessible Usability Scale (AUS) with the goal of measuring user experiences for assistive technology users. The AUS consists of ten questions administered at the end of a user research session to calculate a score. It is inspired by the System Usability Scale, but specifically adapts questions for people using assistive technology.
The AUS is available online (Creative Commons Attribution 4.0), and generates a usability score out of 100. We have collected thousands of AUS submissions and new trends continue to emerge as our data pool grows.
Read about how an AUS score is calculated.
Technology configurations used by assistive technology users (AT users) are captured with every AUS submission to provide a deeper layer of insights. Specifically, we capture:
- The type of device (e.g., Apple iOS, Android mobile, Windows computer, etc.)
- The type of product, web-based or native application
- If web-based, the type of browser being used
The type of assistive technology being used, including:
- Screen magnification (assistive technology that presents enlarged screen content and other visual modifications)
- Alternative navigation (assistive technology that replaces a standard keyboard or mouse)
- Screen readers (assistive technology that outputs on-screen text using text-to-speech)
Screen reader user experiences are poor
A screen reader is software that converts digital experiences into spoken language or Braille. Apple, Windows, Google, Android and others build screen readers into their operating systems to help users with visual and cognitive impairments interact with digital products.
The blind community are the primary users of screen readers. Research by Bourne et al. (2021) estimates that 43.4 million people worldwide are blind, and 295 million people have moderate to severe vision impairment. Screen readers are also used by millions of people who are not visually impaired – for example, people with cognitive impairments, dyslexia, and low literacy levels all report leveraging screen readers.
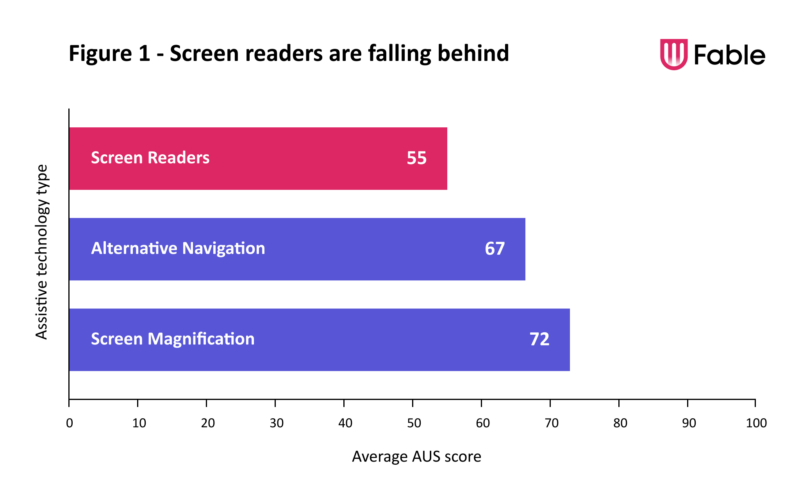
In our 2022 AUS benchmarks blog post, we identified how the experience of screen reader users is worse than other assistive technology users, with the average AUS score for screen readers being 12 points lower than alternative navigation users and a full 17 points lower than screen magnification users.
What does that mean practically? According to our AUS data, 1 in 3 screen reader users believe that they would need the support of another person to use all the features of web-based products and applications, compared to 1 in 7 screen magnification and alternative navigation users. That represents tens of millions of people around the world not able to shop, learn, bank, etc.
The magnitude of the challenges that screen reader users face deserves concentrated attention. The purpose of this study is to dig deeper into the experiences of screen reader users. Specifically, we explore how the three popular screen readers – JAWS for Windows, NVDA for Windows, and VoiceOver for Mac – perform on the AUS, and we recommend questions to ask screen reader users in user research engagements.
Methodology
The AUS is comprised of ten questions, with each question speaking to a different aspect of an assistive tech user’s experience with digital products. Specifically, the AUS asks:
| # | Questions |
|---|---|
| 1 | I would use this web-based product/native application frequently, if I had a reason to. |
| 2 | I found the web-based product/native application unnecessarily complex. |
| 3 | I thought the web-based product/native application was easy to use. |
| 4 | I think that I would need the support of another person to use all the features of this web-based product/native application. |
| 5 | I found the various functions of the web-based product/native application made sense and were compatible with my technology. |
| 6 | I thought there was too much inconsistency in how this web-based product/native application worked. |
| 7 | I would imagine that most people with my assistive technology would learn to use this web-based product/native application quickly. |
| 8 | I found this web-based product/native application very cumbersome or awkward to use. |
| 9 | I felt very confident using the web-based product/native application. |
| 10 | I needed to familiarize myself with the web-based product/native application before I would use it effectively. |
Our goal of this study was to dig into how screen reader users respond to these questions, depending on their screen reader of choice. While it is important to identify if the average AUS score of each screen reader differs, we are most interested in the potential reasons why.
We examined AUS data submissions from screen reader users testing a wide range of digital products. Specifically, we examined data from 568 JAWS users, 374 NVDA users, and 249 VoiceOver users.
We receive AUS submissions from a wide range of screen reader users. Some might be experienced with multiple screen reader types, and others might have used multiple types of assistive technology including a screen reader. Some users have used screen readers their entire lives and others might have started using a screen reader more recently.
We are not comparing apples to apples, but that’s also why we are interested in better understanding assistive technology users – every user is unique.
Takeaways
This is how the screen readers scored on the AUS on a scale from 0 to 100:

According to SUS researchers, a score in the 50s represents a grade of a D. Our data suggests that the experience of screen readers users, regardless of screen reader choice, is poor when using desktop products. In many cases, experiences of screen reader users are frustrating and insufficient.
But as we dig deeper, the data also highlights how not all screen readers are made equal. Specifically, VoiceOver users scored significantly lower than both JAWS (p < .01, 95% C.I. = -10.8, 2.3) and NVDA (p < .05, 95% C.I. = -9.7, -1.5) on the AUS. Whereas, the difference in AUS scores between JAWS and NVDA was not statistically significant (p = .63, 95% C.I. = -2.3, 5.2).
JAWS was the easiest screen reader to use of the three, but 1 in 3 JAWS users still found the desktop product they were testing to be unnecessarily complex. NVDA users felt most confident compared to JAWS and VoiceOver users, but even 1 in 2 NVDA users still did not feel confident using the desktop product they were testing. Despite Voiceover leading the way in making experiences feel familiar, for every 10 users, 6 still felt they needed to familiarize themselves before they could use a product effectively.
VoiceOver: Familiar, but cumbersome
VoiceOver, the native screen reader for MacOS, has some impressive claims to fame. It premiered in 2005 on MacOS X Tiger and functionally changed how a screen reader navigates digital content by introducing a robust soundscape that provided access to visual information such a location on the screen or stylistic formatting. Since then, Apple has continued to improve VoiceOver across all their devices, introducing ground-breaking features like sonification of charts and graphs, AI-based screen recognition to identify unlabeled elements, Siri integration, and new methods of making touchscreen-only maps fully accessible on mobile.
Despite these impressive features, VoiceOver demonstrated the lowest AUS score of the three screen readers. We wanted to know why. Where does it succeed and where does it fall behind?
Where VoiceOver succeeds
It’s important to note that VoiceOver doesn’t fall behind in all areas – it brings a familiarity to the user experience. Specifically, 57% of VoiceOver users felt as though they needed to familiarize themselves with a desktop product before they could use it effectively (AUS question #10). This significantly also outpaces the 67% of JAWS users who felt the same (p < .05, 95% C.I. = -.18, -.01).
This familiarity may be the result of being able to operate entirely in one company’s ecosystem. Specifically, VoiceOver users benefit from consistency across Apple products; they are using Apple’s screen reader on an Apple operating system on Apple hardware. This helps to create a consistency of experience from computer to computer, from app to app, and from site to site. This is an important distinction from Windows-based screen readers, which are developed by different companies with different release cycles. It’s in this consistency that VoiceOver likely succeeds in its familiarity.
Where VoiceOver falls behind
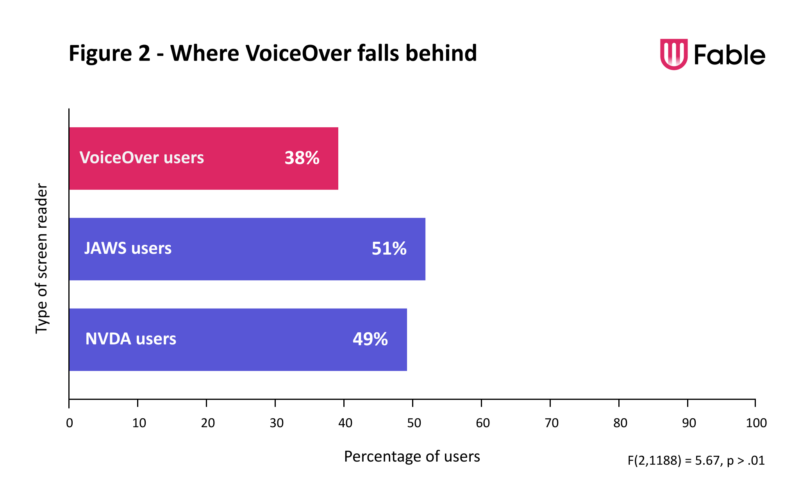
While VoiceOver outperforms JAWS and NVDA in familiarity, it falls behind in its ease of use. Specifically, only 44% of VoiceOver users believed that the desktop product they were testing was easy to use (compared to 51% for both JAWS and NVDA users – AUS question #3), and only 38% imagined that other people with their assistive tech would learn to use the desktop products quickly (compared to 50% for JAWS and NVDA – AUS question #7; F(2,1188) = 5.67, p < .01).
Takeaways
This is how the screen readers scored on the AUS on a scale from 0 to 100:
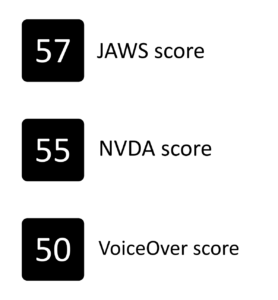
According to SUS researchers, a score in the 50s represents a grade of a D. Our data suggests that the experience of screen readers users, regardless of screen reader choice, is poor when using desktop products. In many cases, experiences of screen reader users are frustrating and insufficient.
But as we dig deeper, the data also highlights how not all screen readers are made equal. Specifically, VoiceOver users scored significantly lower than both JAWS (p < .01, 95% C.I. = -10.8, 2.3) and NVDA (p < .05, 95% C.I. = -9.7, -1.5) on the AUS. Whereas, the difference in AUS scores between JAWS and NVDA was not statistically significant (p = .63, 95% C.I. = -2.3, 5.2).
JAWS was the easiest screen reader to use of the three, but 1 in 3 JAWS users still found the desktop product they were testing to be unnecessarily complex. NVDA users felt most confident compared to JAWS and VoiceOver users, but even 1 in 2 NVDA users still did not feel confident using the desktop product they were testing. Despite Voiceover leading the way in making experiences feel familiar, for every 10 users, 6 still felt they needed to familiarize themselves before they could use a product effectively.
VoiceOver: Familiar, but cumbersome
VoiceOver, the native screen reader for MacOS, has some impressive claims to fame. It premiered in 2005 on MacOS X Tiger and functionally changed how a screen reader navigates digital content by introducing a robust soundscape that provided access to visual information such a location on the screen or stylistic formatting. Since then, Apple has continued to improve VoiceOver across all their devices, introducing ground-breaking features like sonification of charts and graphs, AI-based screen recognition to identify unlabeled elements, Siri integration, and new methods of making touchscreen-only maps fully accessible on mobile.
Despite these impressive features, VoiceOver demonstrated the lowest AUS score of the three screen readers. We wanted to know why. Where does it succeed and where does it fall behind?
Where VoiceOver succeeds
It’s important to note that VoiceOver doesn’t fall behind in all areas – it brings a familiarity to the user experience. Specifically, 57% of VoiceOver users felt as though they needed to familiarize themselves with a desktop product before they could use it effectively (AUS question #10). This significantly also outpaces the 67% of JAWS users who felt the same (p < .05, 95% C.I. = -.18, -.01).
This familiarity may be the result of being able to operate entirely in one company’s ecosystem. Specifically, VoiceOver users benefit from consistency across Apple products; they are using Apple’s screen reader on an Apple operating system on Apple hardware. This helps to create a consistency of experience from computer to computer, from app to app, and from site to site. This is an important distinction from Windows-based screen readers, which are developed by different companies with different release cycles. It’s in this consistency that VoiceOver likely succeeds in its familiarity.
Where VoiceOver falls behind
While VoiceOver outperforms JAWS and NVDA in familiarity, it falls behind in its ease of use. Specifically, only 44% of VoiceOver users believed that the desktop product they were testing was easy to use (compared to 51% for both JAWS and NVDA users – AUS question #3), and only 38% imagined that other people with their assistive tech would learn to use the desktop products quickly (compared to 50% for JAWS and NVDA – AUS question #7; F(2,1188) = 5.67, p < .01).

JAWS: A worthwhile learning curve
JAWS (Job Access with Speech) is a screen reader that was released for Windows in 1995 that is primarily used in corporate environments. It includes custom-programmed support for many apps that are particularly popular at large companies. For example, a significant benefit of JAWS is its custom hotkeys and comprehensive support for the advanced functions across the full Microsoft Office suite of programs. Given its significant feature set and enterprise focus, JAWS is widely regarded as the most preferred screen reader for blind people who work in larger organizations.
Where JAWS succeeds
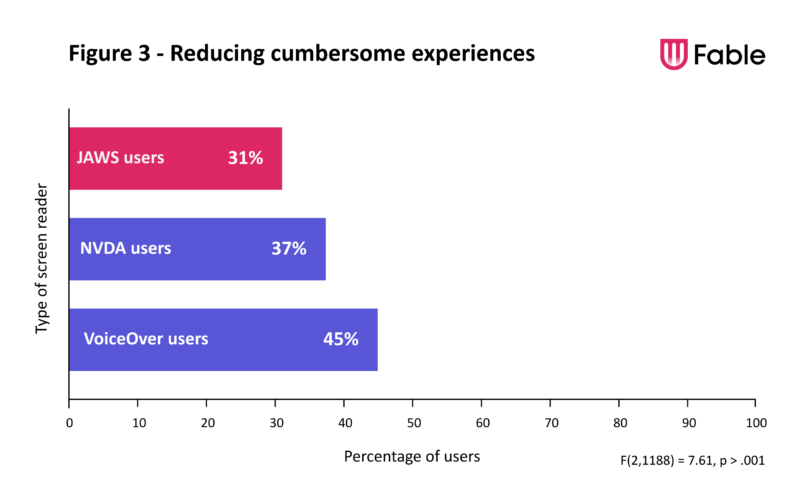
Given its success in the corporate world, it may come as no surprise that JAWS demonstrated the highest AUS score of the three screen readers. Scoring a full 7-points higher than VoiceOver. So, what drives its higher AUS score? JAWS beats out the competition by being the easiest to use. For example, only 32% of JAWS users found the desktop products they were testing unnecessarily complex (compared to 38% of NVDA and 45% VoiceOver users – AUS question #2; F(2,1188) = 6.58, p > .01), and only 31% of users found their desktop products cumbersome or awkward to use (compared to 37% of NVDA and 45% of VoiceOver users – AUS question #8; F(2,1188) = 7.61, p < .001).
This ease of use makes sense. JAWS has the most extensive feature set of the three screen readers and its focus on corporate environments has led to a product where efficiency is particularly important. Due to its corporate use, users are also more likely to receive some sort of training on JAWS compared to VoiceOver and NVDA, which should only serve to facilitate an easy and efficient experience.
Where JAWS falls behind
JAWS facilitates ease of use, however, it does require a bit of a learning curve. Familiarization is the main area where JAWS falls behind, with 67% of JAWS users describing they felt as though they needed to familiarize themselves with the desktop product they were testing before they could use it effectively (AUS question #10). That is a significant jump from how NVDA and VoiceOver users scored on that question (60% and 57%, respectively; F(2,1188) = 3.45, p < .05).
That might just be the JAWS story. Due to its extensive feature set and unique use case, it can take a while for users to be familiar and comfortable using JAWS, but once they become accustomed to what it offers, the same things that create an early learning curve become its biggest strengths, providing an effective and powerful tech option.
JAWS: A worthwhile learning curve
JAWS (Job Access with Speech) is a screen reader that was released for Windows in 1995 that is primarily used in corporate environments. It includes custom-programmed support for many apps that are particularly popular at large companies. For example, a significant benefit of JAWS is its custom hotkeys and comprehensive support for the advanced functions across the full Microsoft Office suite of programs. Given its significant feature set and enterprise focus, JAWS is widely regarded as the most preferred screen reader for blind people who work in larger organizations.
Where JAWS succeeds
Given its success in the corporate world, it may come as no surprise that JAWS demonstrated the highest AUS score of the three screen readers. Scoring a full 7-points higher than VoiceOver. So, what drives its higher AUS score? JAWS beats out the competition by being the easiest to use. For example, only 32% of JAWS users found the desktop products they were testing unnecessarily complex (compared to 38% of NVDA and 45% VoiceOver users – AUS question #2; F(2,1188) = 6.58, p > .01), and only 31% of users found their desktop products cumbersome or awkward to use (compared to 37% of NVDA and 45% of VoiceOver users – AUS question #8; F(2,1188) = 7.61, p < .001).

This ease of use makes sense. JAWS has the most extensive feature set of the three screen readers and its focus on corporate environments has led to a product where efficiency is particularly important. Due to its corporate use, users are also more likely to receive some sort of training on JAWS compared to VoiceOver and NVDA, which should only serve to facilitate an easy and efficient experience.
Where JAWS falls behind
JAWS facilitates ease of use, however, it does require a bit of a learning curve. Familiarization is the main area where JAWS falls behind, with 67% of JAWS users describing they felt as though they needed to familiarize themselves with the desktop product they were testing before they could use it effectively (AUS question #10). That is a significant jump from how NVDA and VoiceOver users scored on that question (60% and 57%, respectively; F(2,1188) = 3.45, p < .05).
That might just be the JAWS story. Due to its extensive feature set and unique use case, it can take a while for users to be familiar and comfortable using JAWS, but once they become accustomed to what it offers, the same things that create an early learning curve become its biggest strengths, providing an effective and powerful tech option.
NVDA: The Goldilocks Zone?
NVDA (Nonvisual Desktop Access) is a screen reader that was originally released in 2006 by blind programmer Michael Curran. As an open-source project, many of the contributors to the software are blind themselves, making NVDA unique because it’s one of the only screen reader solutions developed both by and for blind users. NVDA includes translations into 48 different languages and has worked closely in partnership with Mozilla, enabling NVDA to provide first-class access to the Firefox web browser. As an open-source project primarily funded by donations, NVDA prioritizes support for commonly used programs, and often lacks support for specialized or legacy software. For this reason, it is a leading screen reader in the home, but is far less commonly found in the workplace and other corporate environments.
So how does NVDA compare on the AUS? It’s possible that it might just be the Goldilocks zone – the “just right” option of the three. Let us tell you why.
Where NVDA succeeds
NVDA sits just behind JAWS in its total AUS score, with an overall score of 55, and when breaking out the AUS data by question, NVDA often comes in a healthy second place. For example, screen reader users felt that they needed to familiarize themselves with desktop products far more often with JAWS (67%) than they did with VoiceOver (58%), but NVDA sat squarely in the middle (61% – AUS question #10). On the other hand, 50% of JAWS users felt as though most people with their assistive technology would learn to use the desktop product they were testing quickly compared to only 43% of VoiceOver users, but again, NVDA wasn’t far behind at 49% (AUS question #7).
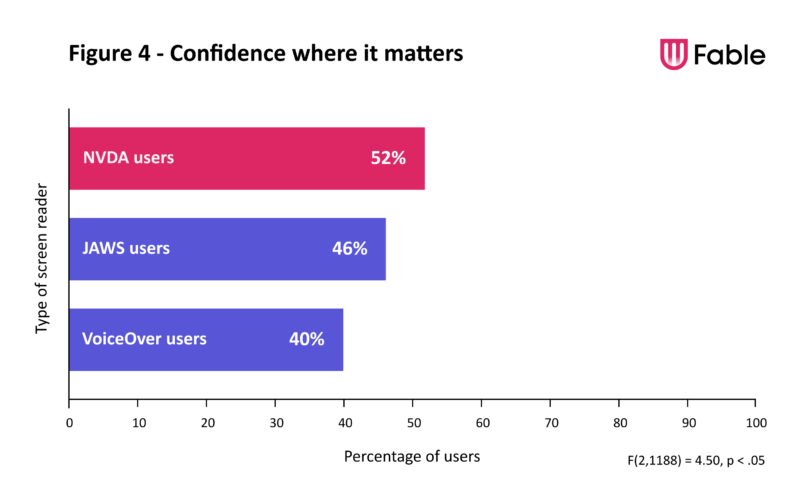
But there is one area that NVDA jumps ahead of the competition – confidence. 52% of NVDA users felt confident using the desktop product they were testing compared to only 46% of JAWS users and 40% of VoiceOver users (AUS question #9; F(2,1188) = 4.50, p < .05). It’s possible that this confidence comes from how NVDA users explore their screen reader. VoiceOver comes built into Apple products, and JAWS is often purchased through a salesperson with support and training. NVDA, on the other hand, is typically installed by choice. This means that NVDA users typically figure their software out on their own, which might push them to explore deeper and wider into the features of the product. In the unique experiences of assistive tech users, this might be one of the most important metrics when understanding how someone experiences digital products through their technology.
Where NVDA falls behind
While it’s used in scientific contexts like astronomy, “The Goldilocks Zone” doesn’t exactly have the most scientific of origins – it comes from a fairy tale about a girl eating bears’ porridge, after all. But the Goldilocks Zone refers to something that is “just right” – like a porridge that is neither too hot nor too cold – and this might be where NVDA really shines.
Of the three screen readers, NVDA is the only option that did not score the lowest on a single AUS question. Where JAWS fell behind in its familiarity and VoiceOver fell behind in its ease of use, NVDA didn’t have a glaring area in the AUS where it fell behind the others.
NVDA’s biggest strength may be exactly that based on our data: it doesn’t really have a primary weakness in comparison to its competition. NVDA is also completely free software, whereas the professional version of JAWS can run users well over $1,000 USD. When you add in the finding that the difference between NVDA and JAWS in their overall AUS score is not statistically significant, there’s a case to be made that NVDA might actually provide the most positive overall experience of the three screen readers.
NVDA: The Goldilocks Zone?
NVDA (Nonvisual Desktop Access) is a screen reader that was originally released in 2006 by blind programmer Michael Curran. As an open-source project, many of the contributors to the software are blind themselves, making NVDA unique because it’s one of the only screen reader solutions developed both by and for blind users. NVDA includes translations into 48 different languages and has worked closely in partnership with Mozilla, enabling NVDA to provide first-class access to the Firefox web browser. As an open-source project primarily funded by donations, NVDA prioritizes support for commonly used programs, and often lacks support for specialized or legacy software. For this reason, it is a leading screen reader in the home, but is far less commonly found in the workplace and other corporate environments.
So how does NVDA compare on the AUS? It’s possible that it might just be the Goldilocks zone – the “just right” option of the three. Let us tell you why.
Where NVDA succeeds
NVDA sits just behind JAWS in its total AUS score, with an overall score of 55, and when breaking out the AUS data by question, NVDA often comes in a healthy second place. For example, screen reader users felt that they needed to familiarize themselves with desktop products far more often with JAWS (67%) than they did with VoiceOver (58%), but NVDA sat squarely in the middle (61% – AUS question #10). On the other hand, 50% of JAWS users felt as though most people with their assistive technology would learn to use the desktop product they were testing quickly compared to only 43% of VoiceOver users, but again, NVDA wasn’t far behind at 49% (AUS question #7).
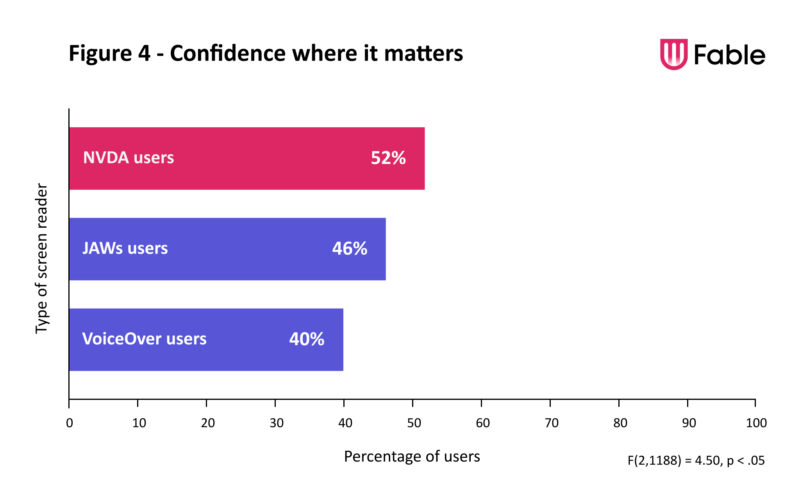
But there is one area that NVDA jumps ahead of the competition – confidence. 52% of NVDA users felt confident using the desktop product they were testing compared to only 46% of JAWS users and 40% of VoiceOver users (AUS question #9; F(2,1188) = 4.50, p < .05). It’s possible that this confidence comes from how NVDA users explore their screen reader. VoiceOver comes built into Apple products, and JAWS is often purchased through a salesperson with support and training. NVDA, on the other hand, is typically installed by choice. This means that NVDA users typically figure their software out on their own, which might push them to explore deeper and wider into the features of the product. In the unique experiences of assistive tech users, this might be one of the most important metrics when understanding how someone experiences desktop products through their technology.
Where NVDA falls behind
While it’s used in scientific contexts like astronomy, “The Goldilocks Zone” doesn’t exactly have the most scientific of origins – it comes from a fairy tale about a girl eating bears’ porridge, after all. But the Goldilocks Zone refers to something that is “just right” – like a porridge that is neither too hot nor too cold – and this might be where NVDA really shines.
Of the three screen readers, NVDA is the only option that did not score the lowest on a single AUS question. Where JAWS fell behind in its familiarity and VoiceOver fell behind in its ease of use, NVDA didn’t have a glaring area in the AUS where it fell behind the others.
NVDA’s biggest strength may be exactly that based on our data: it doesn’t really have a primary weakness in comparison to its competition. NVDA is also completely free software, whereas the professional version of JAWS can run users well over $1,000 USD. When you add in the finding that the difference between NVDA and JAWS in their overall AUS score is not statistically significant, there’s a case to be made that NVDA might actually provide the most positive overall experience of the three screen readers.
Questions to ask in user research interviews with screen reader users
The Accessible Usability Scale (AUS) is a tool that can quantify the perceived user experience of an assistive technology user in task-based user research. Outside of task-based user research, it’s valuable to leverage AUS data when creating user interview scripts. The three following prompts are derived from evaluating where screen reader users score the lowest on the AUS survey.
In the first question, learn about the mental model that the user has created from the user experience, and does it match the intention? The answer to this question aims to broaden the conversation and map to questions 2 and 5 on the AUS. In the second question, learn about how a user needs to familiarize with the product to use it effectively, gaining similar insight provided by question 10. In the third, a standard recommendation but with specificity, to relate to question 7. Even without administering the AUS, you can collect valuable insights into the state of your product’s usability for screen reader users leveraging these prompts.
Limitations and future research questions
No data is perfect – and this data is no exception. Majority of this data is generated by Fable’s community of testers. There are some limitations in this data that deserve to be called out.
First, our testers at Fable are typically more experienced and comfortable with their technology than assistive tech users in the general population and this likely has an impact on how they respond to the AUS. For example, one question reads “I felt very confident using the web-based product/native application.” It is safe to assume that Fable testers feel more confident than comfortable with their respective screen readers than average. What this means is that our data might be conservative, with the average screen reader user needing even more support than what our data at Fable tells us. Moving forward, we want to direct some of our attention to also understanding the average experience of assistive technology users in the broader community and where their most significant pain points lie in their use of digital tools.
Second, the way that assistive tech users engage with digital content can be very different. For example, some users might have extensive experience with multiple screen readers and others might barely have experience with one. Some users might only use a screen reader, whereas others might pair a screen reader with alternative navigation or magnification software. No user is the same. We hope that the size of our sample can help offset these differences, but what we don’t know is the extent to these effects. For example, because JAWS and NVDA are both native to Windows, it’s safe to assume that JAWS users would be more likely to also use NVDA than VoiceOver. Future research should dig into the ways that these user groups overlap and how that impacts their overall experience when using screen readers.
Third, our approach to analyzing the data leans heavily on averaging data points, which underappreciates the value of the non-averages, the extremes. The experiences of assistive technology users are unique, and a deeper analysis of the outer most edges of this data set is an area deserving of qualitative investigation.
Finally, in the interest of brevity, our analyses focused exclusively on desktop screen reader users. We also did not receive enough responses from Narrator users to justify their inclusion in these analyses. As we continue to collect this data over time, it will be important to expand these analyses to also incorporate the experiences with other screen readers.
