Fable’s Annual Community Research Panel Report
Get to know our community of testers and their unique perspectives on navigating the digital world

Fable’s Annual Community Research Panel Report
Get to know our community of testers and their unique perspectives on navigating the digital world
Background
At Fable, we’re committed to digital inclusion for all. Our Community, comprising individuals with disabilities, actively contributes to usability testing, a vital part of enhancing digital accessibility.
This report delves into our Community’s unique perspectives, challenges, and preferences in the digital realm. Our goal is to provide valuable insights to foster more inclusive digital environments.
We express deep gratitude to our Community members for their contributions, which made this report possible. We hope this report sparks meaningful discussions, informs decision-making, and drives innovation in digital accessibility.
Meet our Tester Community
When it comes to the disability community, information on demographics and preferences is sparse and hard to come by. In many contexts, people with disabilities simply are not comfortable sharing this information, with some of the reasons being:
- A fear of discrimination, especially in the workplace. In some cases, people may choose to conceal their disabilities because they fear discrimination or negative repercussions and may even forgo requesting accommodations to avoid disclosure.1
- Anxiety that anything they have to share or contribute may make individuals without disabilities feel awkward or uneasy.2
- Skepticism brought on by not being taken seriously in other contexts, especially healthcare.3
Because of this, we often receive questions about our Community of Testers. Companies that are thinking about working with us are curious to learn more about them, especially when it comes to their personal experiences navigating the web using assistive technology.
We know how valuable such insights can be for organizations that want to make better design decisions and decided to loop our Community in to help make this information accessible to everyone.
Our Tester Community is the heart of what we do at Fable, and we can’t wait to share more about them with you. We’ll lift the curtain a bit to give you a closer look at who they are, what their digital experiences are like, and what they think about the future of technology.
About Fable Engage
Fable Engage is a SaaS platform that connects enterprise companies with assistive technology users for accessibility testing. Customers select the types of assistive technologies and devices they would like to test with. Once their request has been booked, we connect them with members of our Community who utilize those configurations and complete the test within two business days.
Our Community has grown by leaps and bounds since we started Fable, and on an aggregate level has earned $1.2M. In addition to paid training opportunities, Testers also have access to quarterly town halls, exclusive social events, Fable’s skill-building program Pathways, a membership to Bookshare, and more.

“Working at Fable has allowed me to serve as a guide, educator, and advocate for digital accessibility. Through my work, I have raised awareness and fostered understanding among organizations about the significance of inclusive design. Fable has enabled me to broaden my skill set and deepen my knowledge in the realm of digital accessibility. This empowers me to persistently educate and advocate for a digital world that is accessible and user-friendly, positively impacting the lives of people with disabilities.”
Ali K.
Demographics
The following demographic data is about our Community of Testers. It is important to note that this data is specific to our community and may not be representative of the broader community of people with disabilities. Additionally, demographic data is not always necessary to run a successful accessibility test.
- Age: The average age of our testers is 41 years old. The youngest tester is 20 years old and the oldest tester is 74 years old
- Gender: 37% of our testers are female and 57% of our testers are male
- Country: Our testers are from the United States and Canada with the majority of testers living in the United States
- Racial and ethnic backgrounds: Our testers come from a variety of backgrounds, including White, Asian, Black, Hispanic, and Indigenous
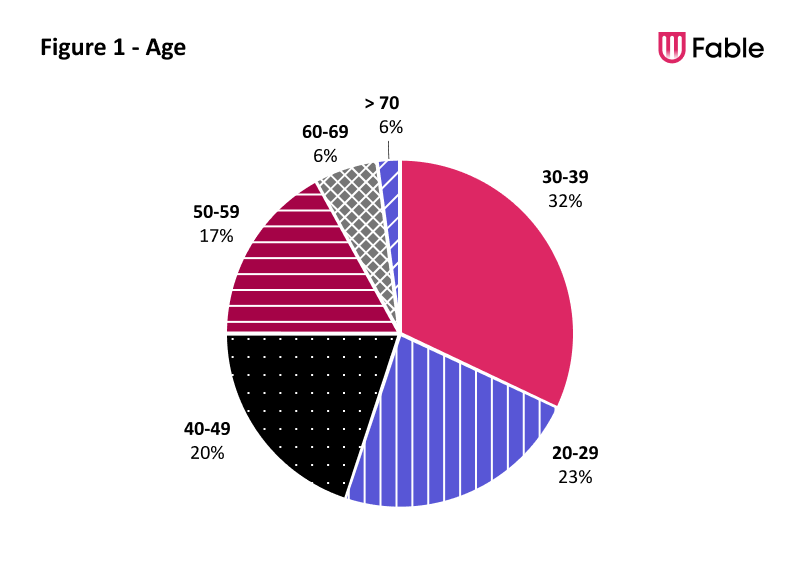
Figure 1 – Age
- 20 to 29 years – 23%
- 30 to 39 years – 32%
- 40 to 49 years – 20%
- 50 to 59 years – 17%
- 60 to 69 years – 6%
- 70 and older – 6%
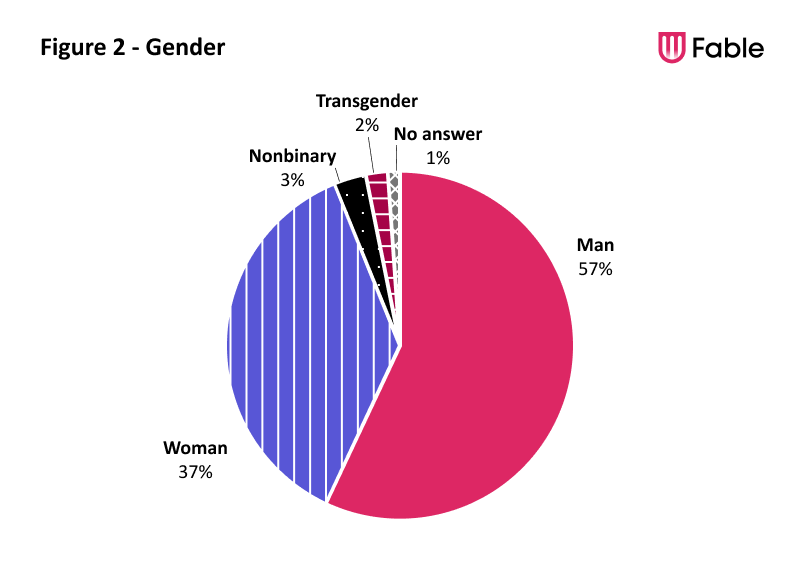
Figure 2 – Gender
- Man – 57%
- Woman – 37%
- Nonbinary – 3%
- Transgender – 2%
- No answer – 1%
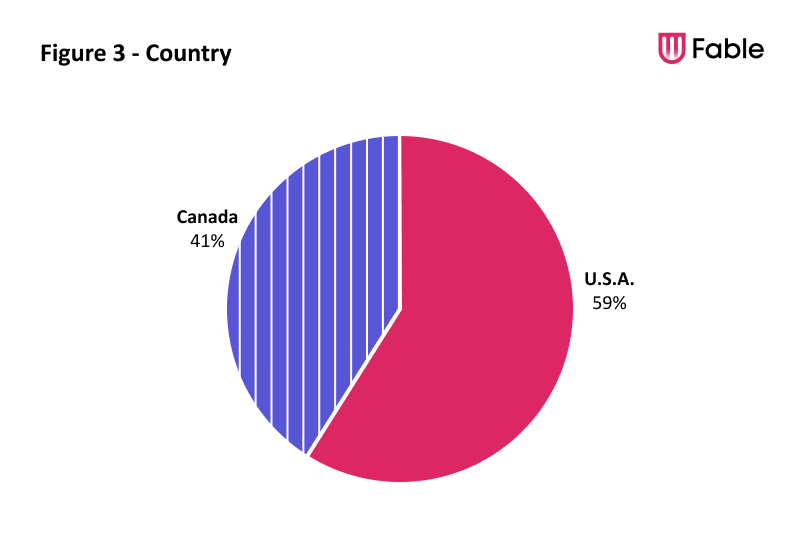
Figure 3 – Country
- Canada – 41%
- U.S.A – 59%
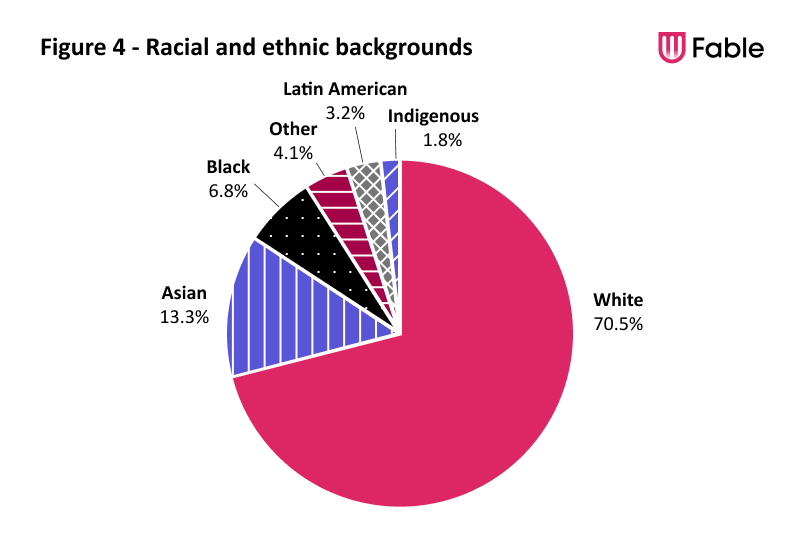
Figure 4 – Racial and ethnic backgrounds
- White – 70.5%
- Asian – 13.3%
- Black – 6.8%
- Other – 4.1%
- Latin American – 3.2%
- Indigenous – 1.8%
Socioeconomic demographics
Fable offers our Testers a great deal of flexibility. Many Testers work other jobs or have other sources of income, and they appreciate being able to choose when and how much they work.
- 3 in 4 Community members are currently working in some capacity
- The majority of those working are in the technology sector
- More than half of our Community members have earned a Bachelor’s degree or higher
- More than half of our Community members make less than $40,000 a year
- Most Community members earn more than 75% of their income from sources outside of Fable
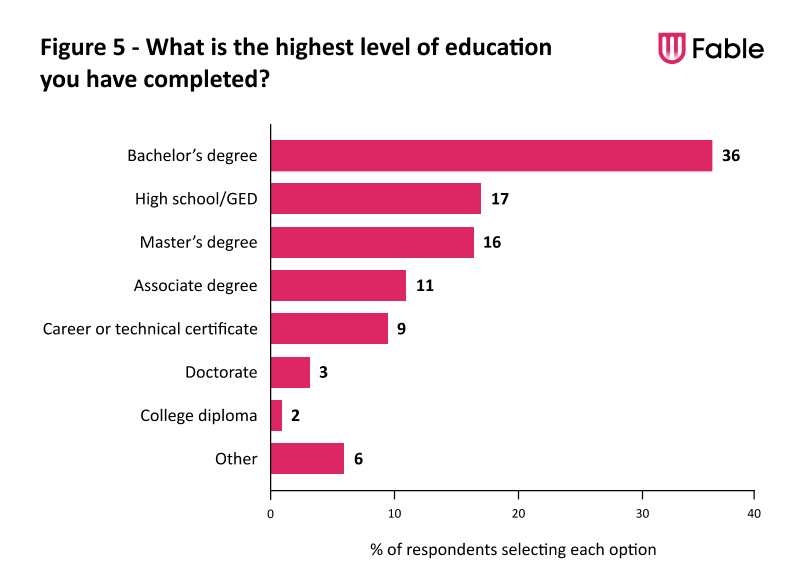
Figure 5 – What is the highest level of education you have completed?
- Bachelor’s degree – 36%
- High school / GED – 17%
- Master’s degree – 16%
- Associate degree – 11%
- Career or technical certificate – 9%
- Doctorate – 3%
- College diploma – 2%
- Other – 6%
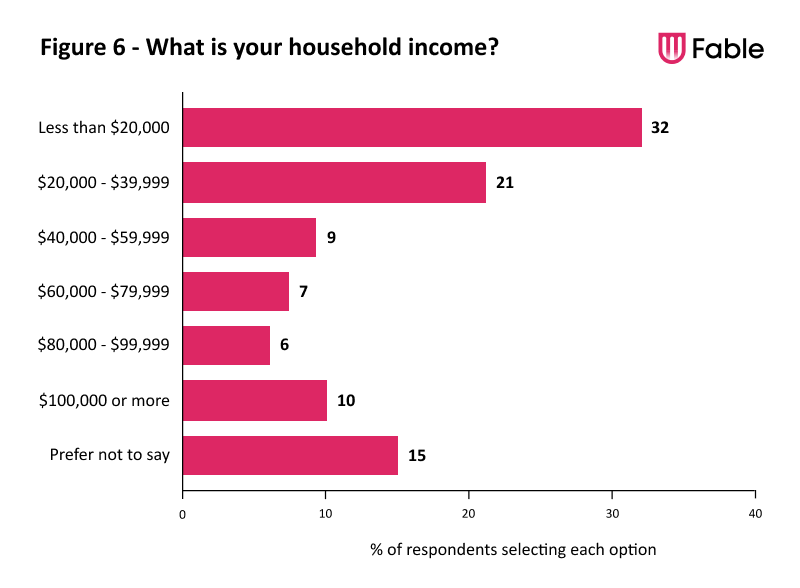
Figure 6 – What is your household income?
- Less than $20,000 – 32%
- $20,000 – $39,999 – 21%
- $40,000 – $59,999 – 9%
- $60,000 – $79,999 – 7%
- $80,000 – $99,999 – 6%
- $100,000 or more – 10%
- Prefer not to say – 15%
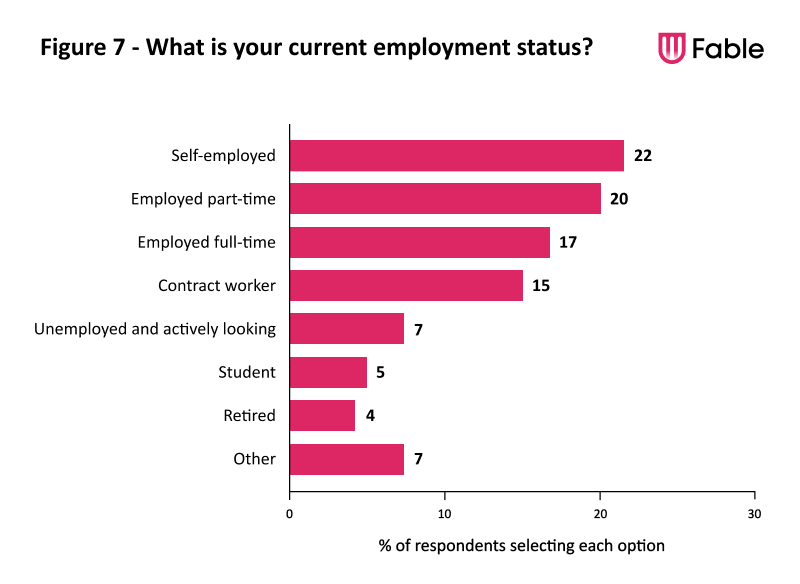
Figure 7 – What is your current employment status?
- Self-employed – 22%
- Employed part-time – 20%
- Employed full-time – 17%
- Contract worker – 15%
- Unemployed and actively looking – 7%
- Student – 5%
- Retired – 4%
- Other – 7%
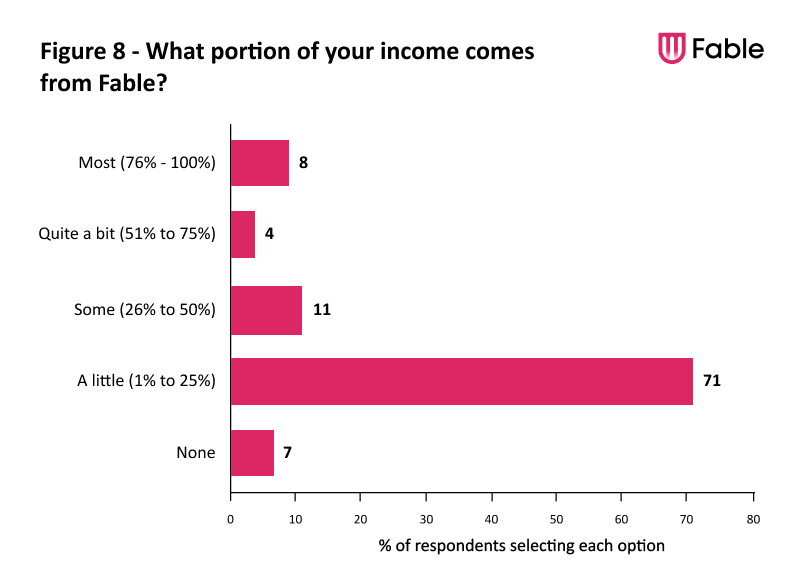
Figure 8 – What portion of your income comes from Fable?
- Most (76% to 100%) – 8%
- Quite a bit (51% to 75%) – 4%
- Some (26% to 50%) – 11%
- A little (1% to 25%) – 71%
- None – 7%
When demographic data is important
At Fable, we believe that demographic data is not essential for accessibility testing. For example, you don’t need to be a certain age to fill out a form on a website. The goal of accessibility testing is to ensure that all assistive technology users can access and use a product or service, regardless of their devices, tools, or abilities.
In addition, there are some potential drawbacks to using demographic data in accessibility testing. For example, demographic data can be outdated or inaccurate. It can also be used to discriminate against certain users. For these reasons, it is important to use demographic data carefully and responsibly when conducting accessibility testing.
However, demographic data can be helpful if we’re looking to learn more about our users during the research process. If the information is used to add context instead of drive analysis, we recognize the value of taking this approach during research.

“As a blind person who uses technology regularly, accessibility has always been something important to me. Working with Fable has enabled me to do my part in helping to make websites and apps accessible for my community. It also gives me the flexibility to concentrate on my singing job, and my journey to seek other opportunities for my singing career. I am beyond grateful for the experience that working for Fable has provided, and the feeling that I am making the world more inclusive for everyone.”
Grace A.
Types of assistive technologies
Most of our Community members (67%) have been native users of their assistive technology for more than ten years. Below are details on our community members’ preferences with assistive technologies
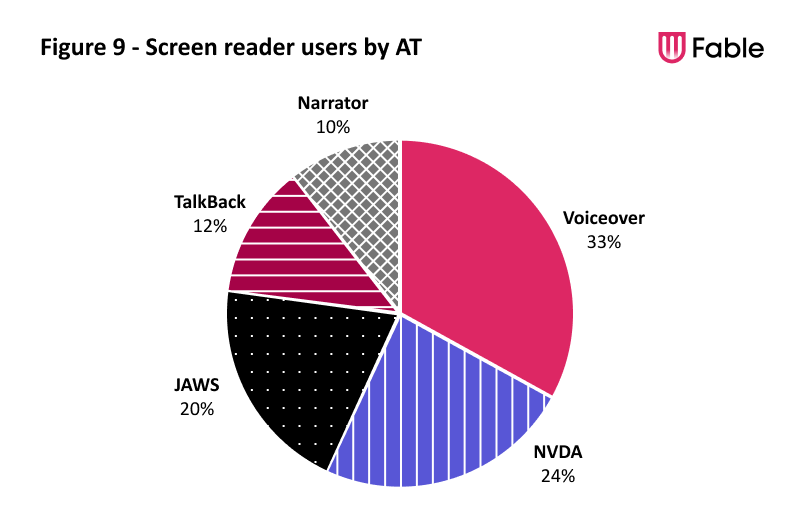
Figure 9 – Screen reader technology
- JAWS – 20%
- NVDA – 24%
- VoiceOver – 33%
- TalkBack – 12%
- Narrator – 10%
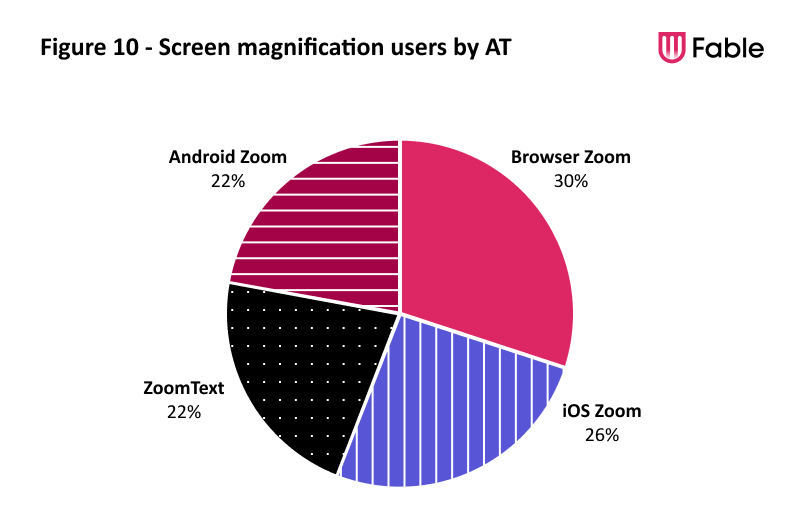
Figure 10 – Screen magnification tools
- ZoomText – 22%
- iOS Zoom – 26%
- Android Zoom – 22%
- Browser Zoom – 30%
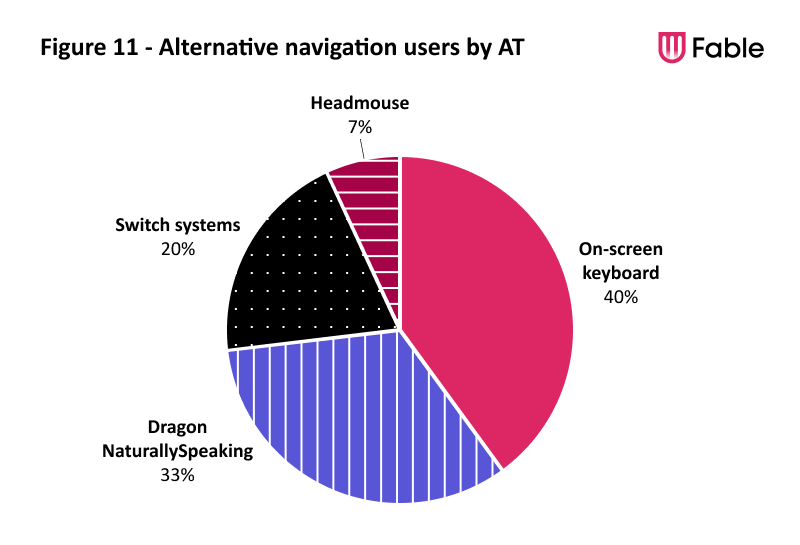
Figure 11 – Alternative navigation tools
- Dragon NaturallySpeaking – 33%
- Switch systems – 20%
- Headmouse – 7%
- On-screen keyboard – 40%
Devices, programs, and apps
In this section, we explored the programs, apps, and devices that our Community uses to access information and content regularly.
Operating systems and browsers
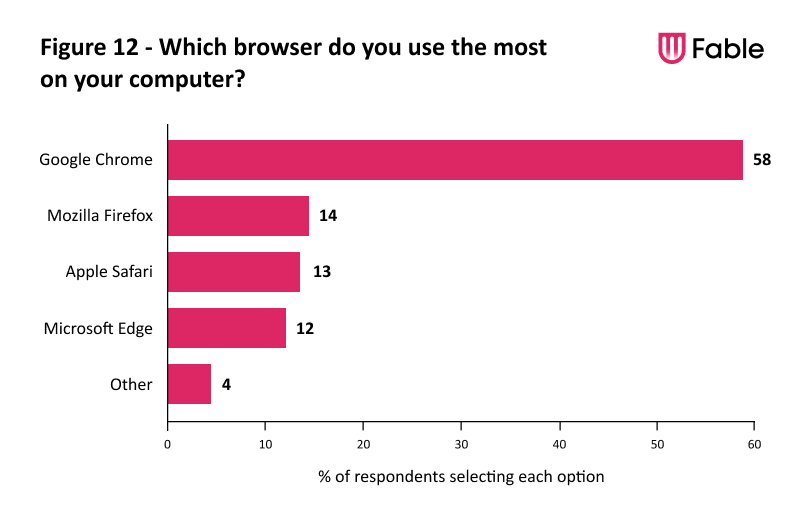
Figure 12 – Which browser do you use the most on your computer?
- Google Chrome – 58%
- Mozilla Firefox – 14%
- Apple Safari – 13%
- Microsoft Edge – 12%
- Other – 4%
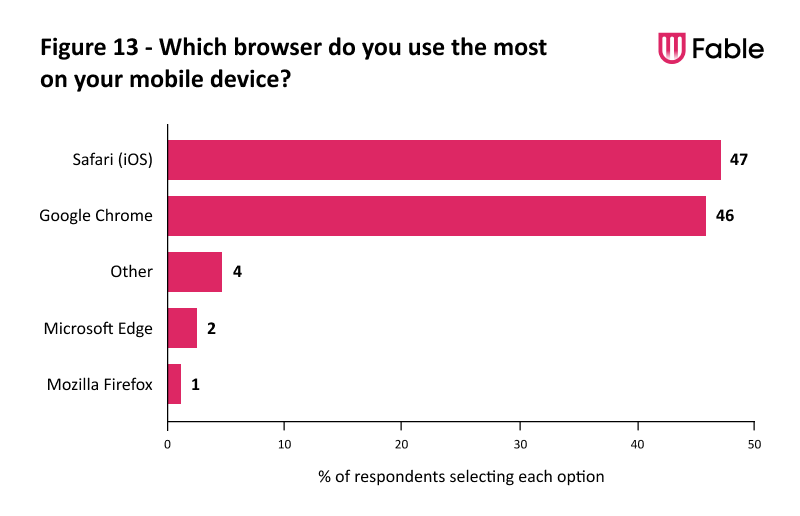
Figure 13 – Which browser do you use the most on your mobile?
- Safari (iOS) – 47%
- Google Chrome – 46%
- Other – 4%
- Microsoft Edge – 2%
- Mozilla Firefox – 1%
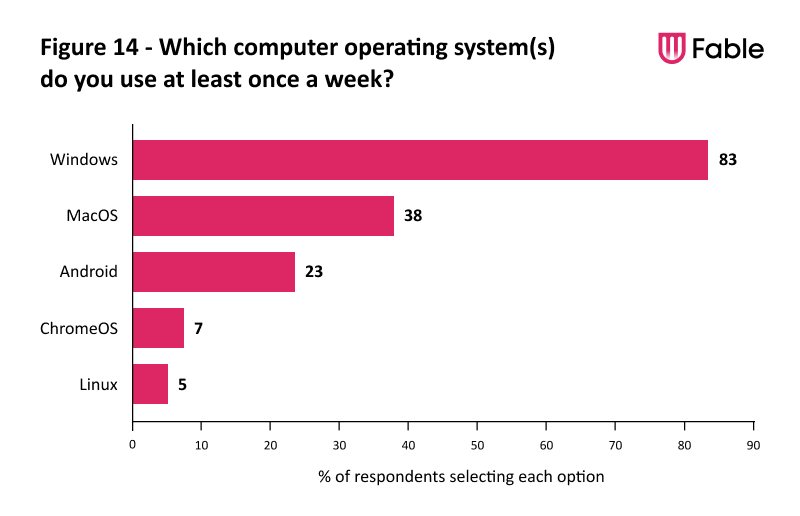
Figure 14 – Which computer operating system(s) do you use at least once a week?
- Windows – 83%
- MacOS – 28%
- Android – 23%
- ChromeOS – 7%
- Linux – 5%
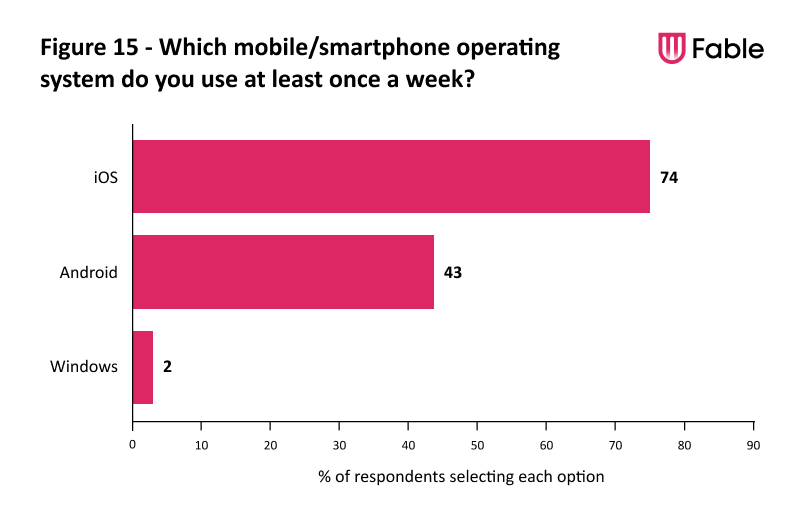
Figure 15 – Which mobile/smartphone operating system do you use at least once a week?
- iOS – 74%
- Android – 43%
- Windows – 2%
Smart devices and voice assistants
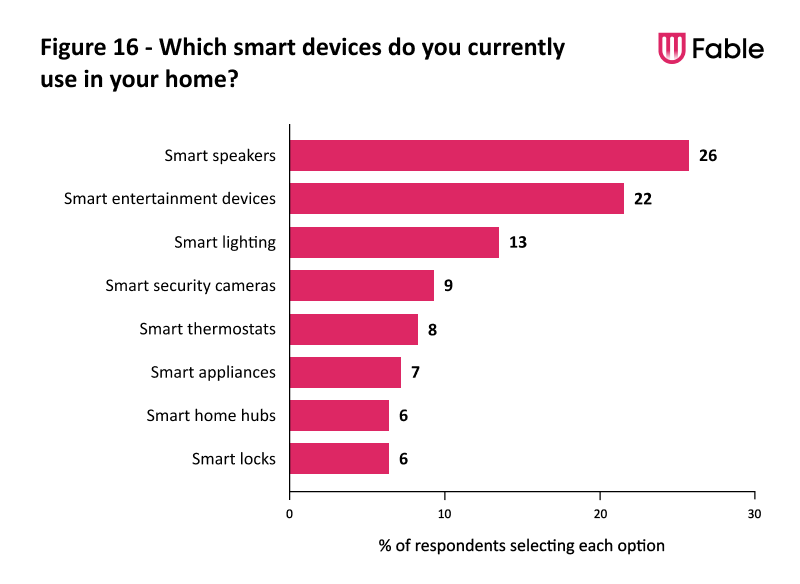
Figure 16 – Which smart devices do you currently use in your home?
- Smart speakers – 26%
- Smart entertainment devices – 22%
- Smart lighting – 13%
- Smart security cameras – 9%
- Smart thermostats – 8%
- Smart appliances – 7%
- Smart home hubs – 6%
- Smart locks – 6%
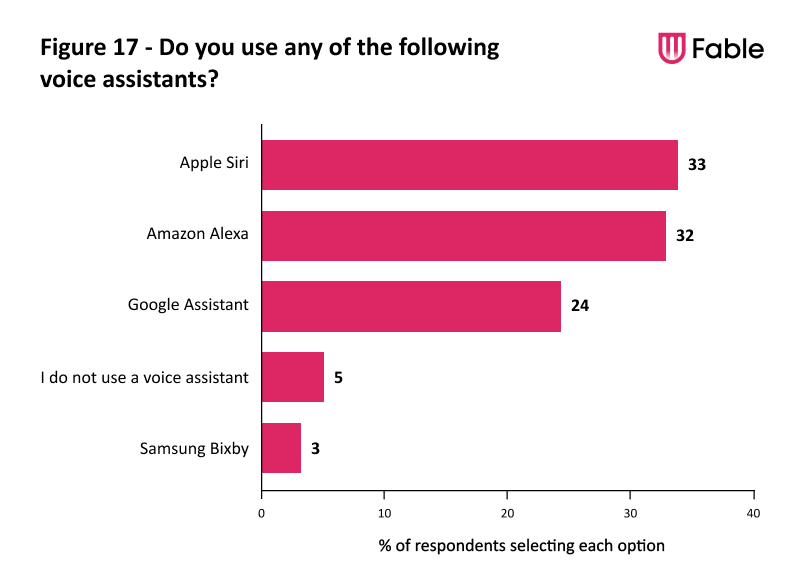
Figure 17 – Do you use any of the following voice assistants?
- Apple Siri – 33%
- Amazon Alexa – 32%
- Google Assistant – 24%
- I do not use a voice assistant – 5%
- Samsung Bixby – 3%
Streaming and video games
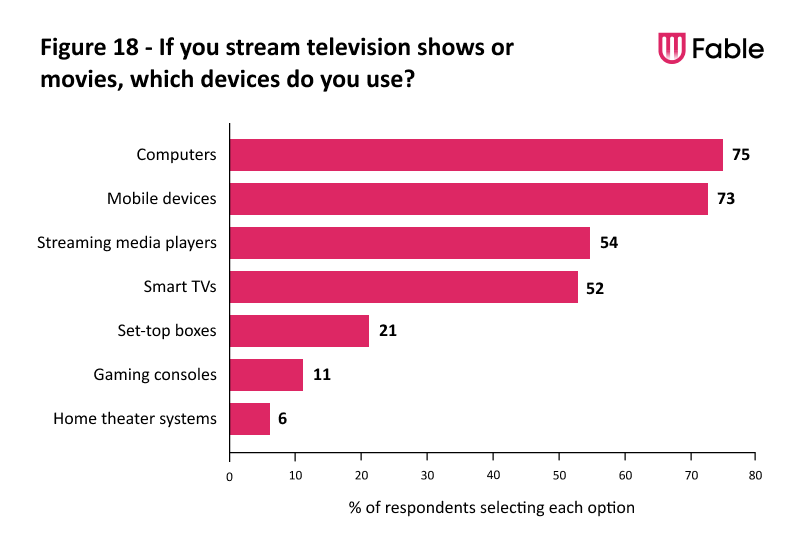
Figure 18- If you stream television shows or movies, which devices do you use?
- Computers – 75%
- Mobile devices – 73%
- Streaming media players – 54%
- Smart TVs – 52%
- Set-top boxes – 21%
- Gaming consoles – 11%
- Home theater systems – 6%
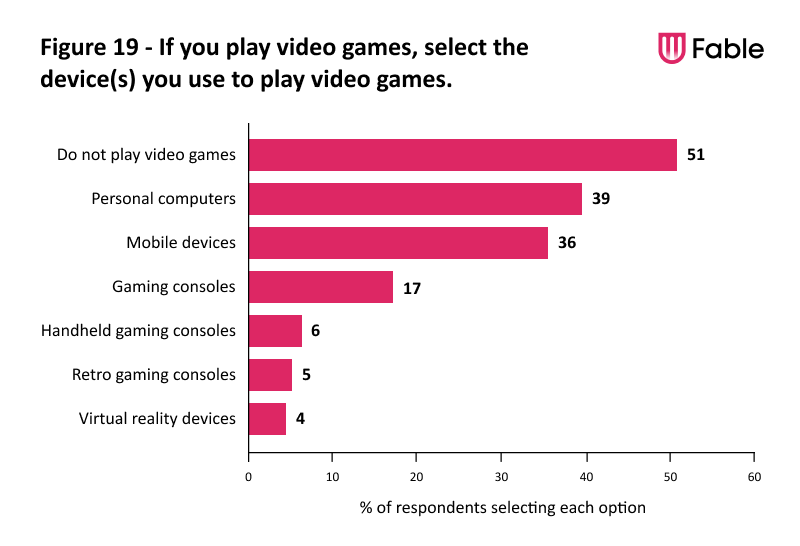
Figure 19 – If you play video games, select the device(s) you use to play video games
- Do not play video games – 51%
- Personal computers – 39%
- Mobile devices – 36%
- Gaming consoles – 17%
- Handheld gaming consoles – 6%
- Retro gaming consoles – 5%
- Virtual reality devices – 4%

“I have been an accessibility tester for Fable for over a year. After being introduced to accessibility, I felt a desire to share what I learned with others. I feel like I have found my purpose with helping make the digital space fully accessible. Because of Fable, I am pursuing my IAAP Certified Professional in Accessibility Core Competencies (CPACC) certification so I can better assist our clients.
Rhonel C.
Websites & apps by industry
In the next part of the survey, we asked our Community how satisfied they were with the accessibility of websites and apps in different industries. We understand that some industries have exceptional examples while others may have poor ones. Our goal was to learn about the experiences they encounter most often.
When it comes to desktop websites, our Community was the most satisfied with the accessibility of banking websites and streaming services. They were the most dissatisfied with the accessibility of travel and hospitality websites as well as maps and way-finding websites.
In most cases, the Community’s impression of each industry increased on mobile. Streaming apps maintained their position as the industry with which our Community was most satisfied, as did travel and hospitality websites as the mobile experience with which our Community was most dissatisfied.
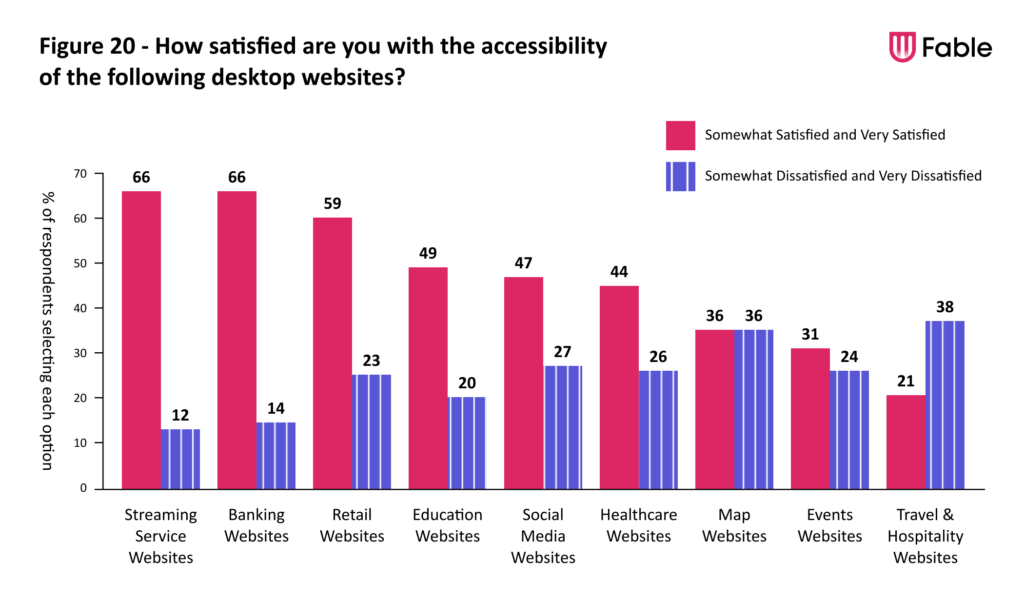
Figure 20 – How satisfied are you with the accessibility of the following desktop websites?
- Streaming services websites – 66% very to somewhat satisfied, 12% somewhat to very dissatisfied
- Banking websites – 66% very to somewhat satisfied, 14% somewhat to very dissatisfied
- Retail websites – 59% very to somewhat satisfied, 20% somewhat to very dissatisfied
- Education websites – 49% very to somewhat satisfied, 14% somewhat to very dissatisfied
- Social media websites – 47% very to somewhat satisfied, 27% somewhat to very dissatisfied
- Healthcare websites – 44% very to somewhat satisfied, 26% somewhat to very dissatisfied
- Map websites – 31% very to somewhat satisfied, 36% somewhat to very dissatisfied
- Events websites – 31% very to somewhat satisfied, 24% somewhat to very dissatisfied
- Travel and hospitality websites – 22% very to somewhat satisfied, 38% somewhat to very dissatisfied
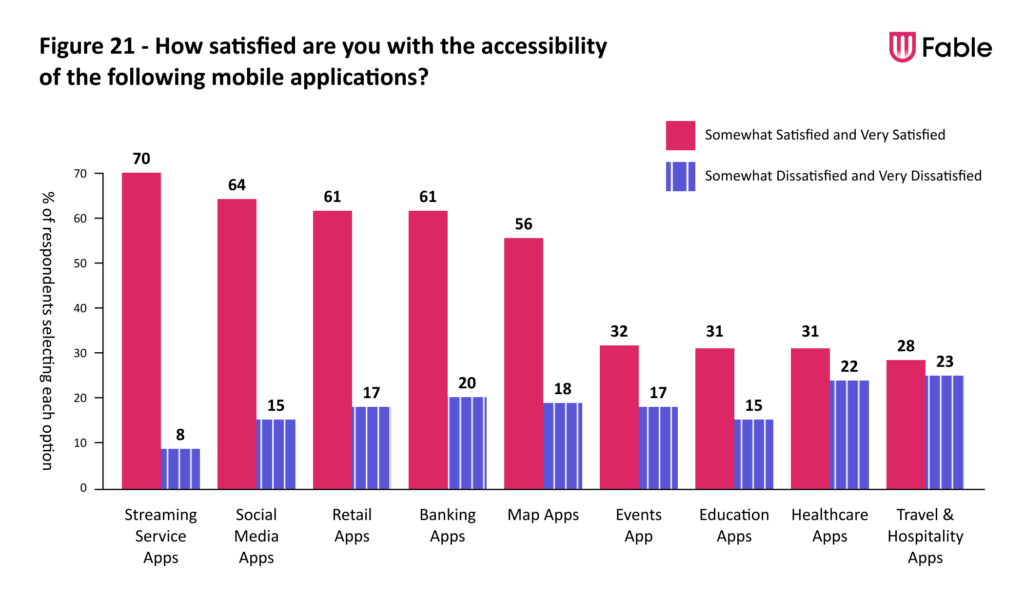
Figure 21 – How satisfied are you with the accessibility of the following mobile applications?
- Streaming services apps – 70% very to somewhat satisfied, 8% somewhat to very dissatisfied
- Social media apps – 64% very to somewhat satisfied, 15% somewhat to very dissatisfied
- Retail apps – 61% very to somewhat satisfied, 17% somewhat to very dissatisfied
- Banking apps – 61% very to somewhat satisfied, 20% somewhat to very dissatisfied
- Map apps – 56% very to somewhat satisfied, 18% somewhat to very dissatisfied
- Events apps – 32% very to somewhat satisfied, 17% somewhat to very dissatisfied
- Education apps – 31% very to somewhat satisfied, 15% somewhat to very dissatisfied
- Healthcare apps – 31% very to somewhat satisfied, 22% somewhat to very dissatisfied
- Healthcare apps – 31% very to somewhat satisfied, 22% somewhat to very dissatisfied
- Travel and Hospitality apps – 28% very to somewhat satisfied, 23% somewhat to very dissatisfied
What is interesting about this data is that when asked if they have a preference to use either desktop websites or mobile applications when a business offers both, more than half of the members of the Community indicated that they prefer to use desktop websites.
Regarding communication tools, email and video conferencing tools also have high levels of satisfaction, while live chat widgets are the tool with the lowest satisfaction scores.
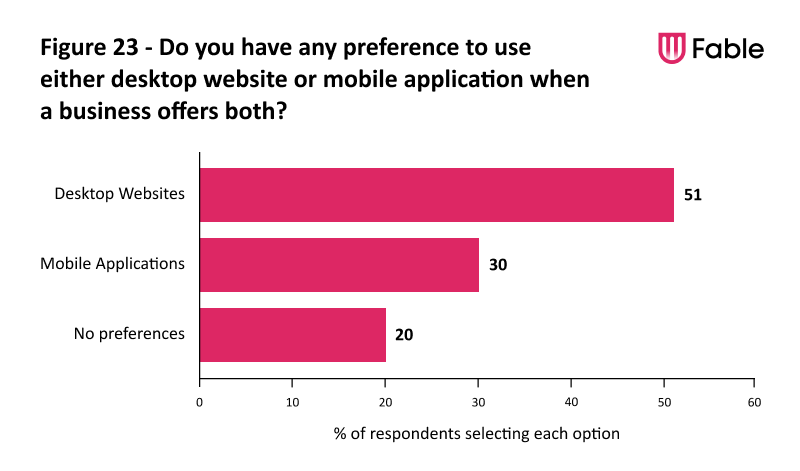
Figure 23 – Do you have any preference to use either desktop website or mobile application when a business offers both?
- Desktop websites – 51%
- Mobile applications – 30%
- No preferences – 20%
Why brands should invest in accessibility
The majority of our Community members (3 out of 4) choose the devices they’ve mentioned because they are the most accessible options, and 9 in 10 respondents will try to find a better option when they come across an inaccessible brand and then stick with it once they find one that meets their needs. This was one of the clearest takeaways in the data for us, as it validates what we’ve previously reported about brand loyalty amongst assistive technology users and those with disabilities:
“Assistive technology users and those with disabilities show brand loyalty towards companies that have accessible and usable experiences. They will choose your competitor who has a more usable and accessible experience.”
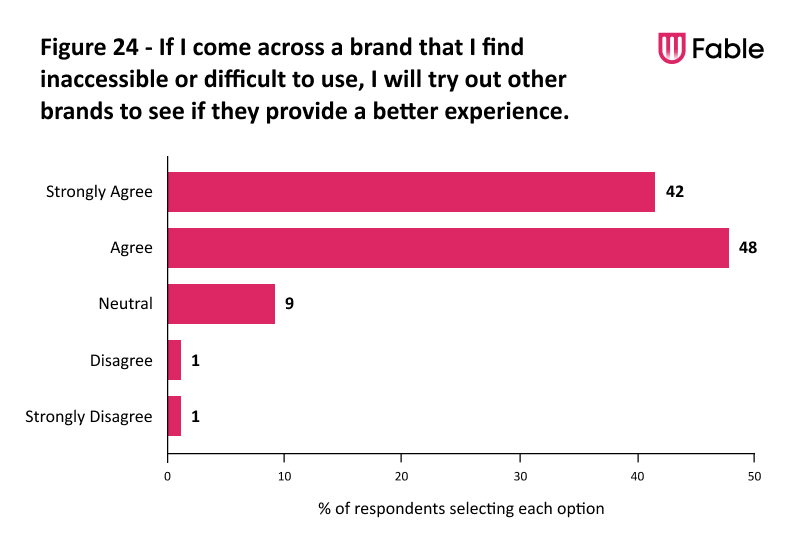
Figure 24 – If I come across a brand that I find inaccessible or difficult to use, I will try out other brands to see if they provide a better experience.
- Strongly agree – 42%
- Agree – 48%
- Neutral – 9%
- Disagree – 1%
- Strongly disagree – 1%
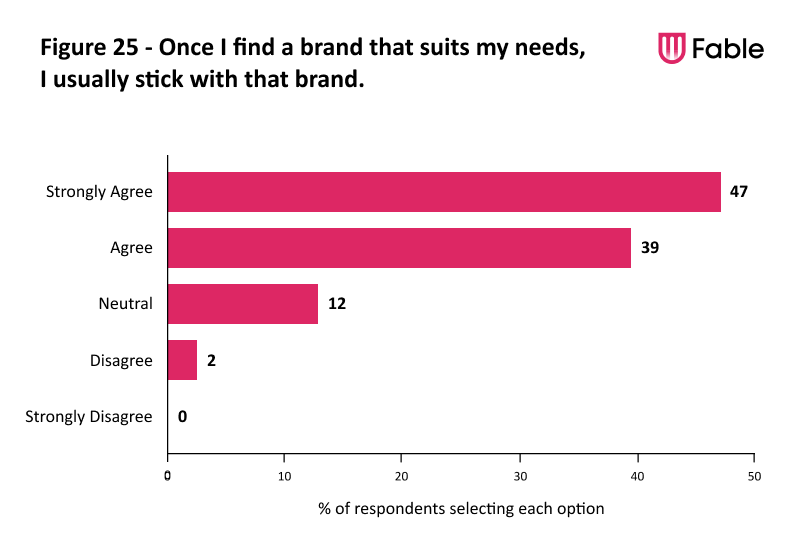
Figure 25 – Once I find a brand that suits my needs, I usually stick with that brand.
- Strongly agree – 47%
- Agree – 39%
- Neutral – 12%
- Disagree – 2%
- Strongly disagree – 0%

“I had lost the ability to speak, see, swallow, and all functions of the right side of my body including my arms, leg, and face within hours. I had to go to inpatient rehabilitation therapy for a couple of years, but I learned a lot about myself and the world around me. I was able to continue college after two years and graduated with a Bachelor’s of Applied Technology in 2015. I applied this understanding of computers at a few jobs but felt like I wanted more. When I found Fable, I was really excited to interview but I never thought I’d get a job with them. To my surprise, I was hired! I now feel like my life is making a difference to the world. I’m improving people’s lives through my disability and computer knowledge. I’ve come to realize that as long as you’re patient and have understanding, anything is possible. I am extremely grateful that Fable has blessed me with a reason to feel successful.”
Thomas M.
In conclusion
In this report, we’ve shared: our community’s demographics, assistive technologies used, our community’s preferences on devices, online shopping and gaming.
This report clearly highlights that the accessibility of an experience limits the choices for our community to participate and take advantage of digital products and services.
We hope that these insights will act as a compass, helping you shape how you think about how people with disabilities interact online. Our aim is for you to make informed decisions that go beyond mere compliance, decisions driven by empathy, and a sincere commitment to meaningful progress. As you move forward, may these insights serve as a guiding light on your journey toward a digital world where equal access is the norm, allowing everyone to thrive.
